Type C: Practical/Knowledge-Based Questions
1. Execute the following codes and find out what happens? (Libraries have been imported already; plt is the alias name for matplotlib.pyplot )
(a)
A = np.arange(2, 20, 2)
B = np. log(A)
plt.p1ot(A, B)
(b)
A = np.arange(2, 20, 2)
B = np.log(A)
plt.bar(A, B)
(c)
X = np.arange(l, 18, 2.655)
B = np.log(X)
plt.scatter(X, Y)
Will any code produce error? Why/Why not?
Ans: (a) No ERROR
(b) No ERROR
(c) No ERROR
Because, plot( ) , bar( ) and scatter( ) function of PyPlot require two axis values, and these two axes values are passed.
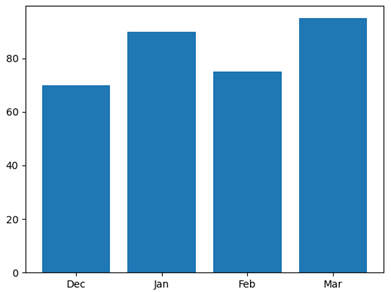
2. Write the output from the given python code:
import matplotlib.pyplot as plt
Months = [‘Dec’, ‘Jan’, ‘Feb’, ‘Mar’]
Attendance = [70, 90, 75, 95]
plt.bar(Months, Attendance)
plt.show()
Ans:
3. Write a program to add titles for the X-axis, Y-axis and for the whole chart in the above codes.
Ans: plt.xlabel(“X-Axis”)
plt.ylabel(“Y-Axis”)
plt.title(“Chart Title”)
4. plt.plot(A, B) produces (A and B are the sequences same as created in question 2) chart as :
Write codes to produce charts as shown below :
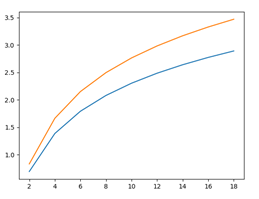
A vs B’s every value * 1.2
A vs B
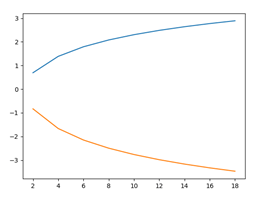
A vs B’s every value * -1.2
Ans:
(a) import matplotlib.pyplot as plt
import numpy as np
A = np.arange(2,20, 2)
B = np.log(A)
plt.plot(A, B)
plt.plot(A, B*1.2)
plt.show()
(b) import matplotlib.pyplot as plt
import numpy as np
A = np.arange(2,20, 2)
B = np.log(A)
plt.plot(A, B)
plt.plot(A, B*-1.2)
plt.show()