
AISSCE XII Informatics Practices 065 – Practical Question Paper Set #2 – Download Word File
All India Senior Secondary Certificate Examination
XII Informatics Practices 065- Practical Question Paper Set #2
Answer Key of Set – 2 Practical Examination Question Paper
Answer Key Set – 2
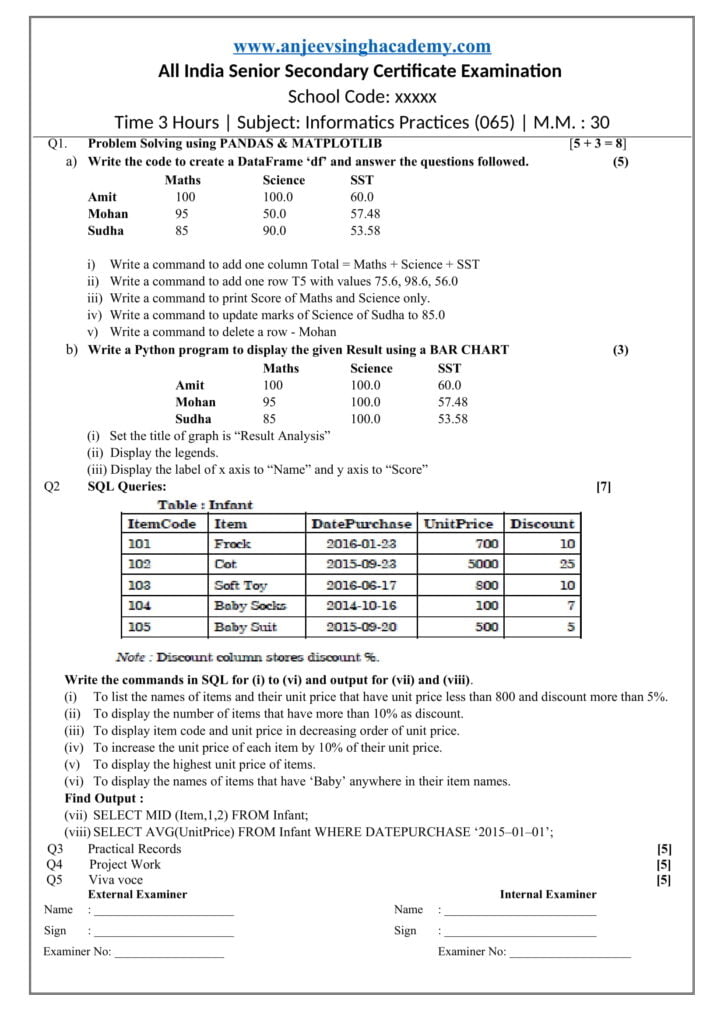
Q1. Problem Solving using PANDAS & MATPLOTLIB [5 + 3 = 8]
A. Write the code to create a DataFrame ‘df’ and answer the questions followed. (5)
Maths Science SST
Amit 100 100.0 60.0
Mohan 95 50.0 57.48
Sudha 85 90.0 53.58
(i) Write a command to add one column Total = Maths + Science + SST
(ii) Write a command to add one row T5 with values 75.6, 98.6, 56.0
(iii) Write a command to print Score of Maths and Science only.
(iv) Write a command to update marks of Science of Sudha to 85.0
(v) Write a command to delete a row – Mohan
Answer:
import pandas as pd
data = {‘Maths’:{‘Amit’:100, ‘Mohan’:95, ‘Sudha’:85},
‘Science’:{‘Amit’:100, ‘Mohan’:50, ‘Sudha’:90},
‘SST’:{‘Amit’:60, ‘Mohan’:57.48, ‘Sudha’:53.58}
}
df = pd.DataFrame(data)
>>> df
Maths Science SST
Amit 100 100 60.00
Mohan 95 50 57.48
Sudha 85 90 53.58
(i) df[‘Total’] = df[‘Maths’]+df[‘Science’]+df[‘SST’]
>>> df
Maths Science SST Total
Amit 100 100 60.00 260.00
Mohan 95 50 57.48 202.48
Sudha 85 90 53.58 228.58
(ii) df.loc[‘T5’,: ] = [75.6, 98.6, 56.6, 230.8]
>>> df
Maths Science SST Total
Amit 100.0 100.0 60.00 260.00
Mohan 95.0 50.0 57.48 202.48
Sudha 85.0 90.0 53.58 228.58
T5 75.6 98.6 56.60 230.80
(iii) df[ [‘Maths’, ‘Science’] ]
Maths Science
Amit 100.0 100.0
Mohan 95.0 50.0
Sudha 85.0 90.0
T5 75.6 98.6
(iv) df.at[‘Sudha’,’Science’] = 85.0
>>> df
Maths Science SST Total
Amit 100.0 100.0 60.00 260.00
Mohan 95.0 50.0 57.48 202.48
Sudha 85.0 85.0 53.58 228.58
T5 75.6 98.6 56.60 230.80
(v) df = df.drop(‘Mohan’)
Maths Science SST Total
Amit 100.0 100.0 60.00 260.00
Sudha 85.0 85.0 53.58 228.58
T5 75.6 98.6 56.60 230.80
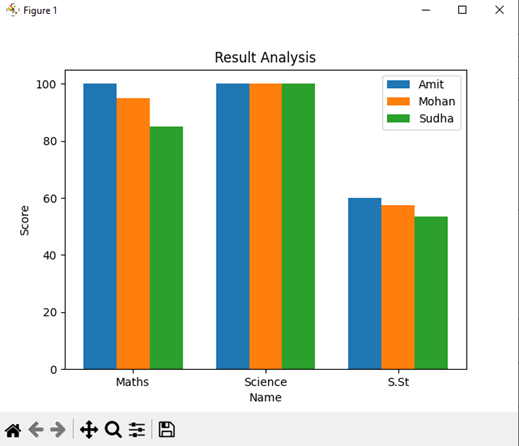
B. Write a Python program to display the given Result using a BAR CHART (3)
Maths Science SST
Amit 100 100.0 60.0
Mohan 95 100.0 57.48
Sudha 85 100.0 53.58
(i) Set the title of the graph as “Result Analysis”.
(ii) Display the legends.
(iii) Display the label of x axis to “Name” and y axis to “Score”
Answer:
import matplotlib.pyplot as plt
import numpy as np

Subject = ['Maths','Science', 'S.St']

Amit = [100, 100.0, 60.0]
Mohan = [95, 100.0, 57.48]
Sudha = [85,100.0,53.58]

x_axis = np.arange(len(Subject))

plt.bar(x_axis - 0.25 , Amit, 0.25, label='Amit')
plt.bar(x_axis, Mohan, 0.25, label='Mohan')
plt.bar(x_axis + 0.25, Sudha,0.25, label='Sudha')

plt.xticks(x_axis, Subject)

plt.legend(loc =1)

plt.xlabel("Name")
plt.ylabel("Score")
plt.title("Result Analysis")

plt.show()
Output:
Q2 SQL Queries: [7]
Write the commands in SQL for (i) to (vi) and output for (vii) and (viii).
- To list the names of items and their unit price that have unit price less than 800 and discount more than 5%.
Answer: SELECT ITEM, UNITPRICE FROM INFANT
WHERE UNITPRICE < 800 AND DISCOUNT > 5 ;
- To display the number of items that have more than 10% as discount.
Answer: SELECT COUNT(*) FROM INFANT
WHERE DISCOUNT > 10 ;
- To display item code and unit price in decreasing order of unit price.
Answer: SELECT ITEMCODE, UNITPRICE FROM INFANT
ORDER BY UNITPRICE DESC;
- To increase the unit price of each item by 10% of their unit price.
Answer: UPDATE INFANT SET UNITPRICE = UNITPRICE + UNITPRICE * 10/100 ;
- To display the highest unit price of items.
Answer: SELECT MAX(UNITPRICE) FROM INFANT;
- To display the names of items that have ‘Baby’ anywhere in their item names.
Answer: SELECT ITEM FROM INFANT
WHERE ITEM LIKE ‘%BABY%’ ;
- Find Output :
(i) SELECT MID (Item,1,2) FROM Infant;
Answer:
| MID (ITEM, 1,2) |
| Fr |
| Co |
| So |
| Ba |
| Ba |
(ii) SELECT AVG(UnitPrice) FROM Infant WHERE DATEPURCHASE = ‘2015–01–01’;
Answer:
| AVG(UnitPrice) |
| 1420 |


