
AISSCE XII Informatics Practices 065 – Practical Question Paper Set #5 – Download Word File
All India Senior Secondary Certificate Examination
XII Informatics Practices 065- Practical Question Paper Set #5
Answer Key of Set – 5 Practical Examination Question Paper
Answer Key Set – 5
Q1. Problem Solving using PANDAS & MATPLOTLIB [5 + 3 = 8]
A. Write a program in Python Pandas to create the following DataFrame batsman from a Dictionary: (5)
B_NO Name Score1 Score2
1 Sunil Pillai 90 80
2 Gaurav Sharma 65 45
3 Piyush Goel 70 90
4 Kartik Thakur 80 76
Perform the following operations on the DataFrame :
(i) Add both the scores of a batsman and assign to column “Total”.
(ii) Display the highest score in both Score1 and Score2 of the DataFrame.
(iii) Display the DataFrame.
(iv) Display the details of Piyush Goel
Answer:
#Question-1.a)
#Creating DataFrame
import pandas as pd
BNo = [1,2,3,4]
Name = [‘Sunil Pillai’, ‘Gaurav Sharma’,
‘Piyush Goel’, ‘Kartik Thakur’]
Score1 = [90, 65, 70, 80]
Score2 = [80, 45, 90, 76]
data = {‘B_NO’:BNo, ‘Name’:Name,
‘Score1’:Score1, ‘Score2’:Score2
}
batsman = pd.DataFrame(data)
print(batsman)
Output:
B_NO Name Score1 Score2
0 1 Sunil Pillai 90 80
1 2 Gaurav Sharma 65 45
2 3 Piyush Goel 70 90
3 4 Kartik Thakur 80 76
i) Add both the scores of a batsman and assign to column “Total”
print(“\n\n#i.Add both the scores of a batsman and assign to column Total \n\n”)
batsman[‘Total’] = batsman[‘Score1’] + batsman[‘Score2’]
print(batsman)
Output:
#i.Add both the scores of a batsman and assign to column Total
B_NO Name Score1 Score2 Total
0 1 Sunil Pillai 90 80 170
1 2 Gaurav Sharma 65 45 110
2 3 Piyush Goel 70 90 160
3 4 Kartik Thakur 80 76 156
ii) Display the highest score in both Score1 and Score2 of the DataFrame.
print(“\n\n#ii. Display the highest score in both Score1 and Score2 of the DataFrame\n\n”)
print(“Highest of Score 1 : “, batsman[‘Score1’].max())
print(“Highest of Score 2 : “, batsman[‘Score2’].max())
Output:
#ii. Display the highest score in both Score1 and Score2 of the DataFrame
Highest of Score 1: 90
Highest of Score 2: 90
iii) Display the DataFrame.
print(“\n\n#iii. Display the DataFrame \n\n”)
print(batsman)
Output:
#iii. Display the DataFrame
B_NO Name Score1 Score2 Total
0 1 Sunil Pillai 90 80 170
1 2 Gaurav Sharma 65 45 110
2 3 Piyush Goel 70 90 160
3 4 Kartik Thakur 80 76 156
iv) Display the details of Piyush Goel
print(“\n\n#iv. Display the details of Piyush Goel \n\n”)
print(batsman[batsman[‘Name’] == ‘Piyush Goel’])
Output:
#iv. Display the details of Piyush Goel
B_NO Name Score1 Score2 Total
2 3 Piyush Goel 70 90 160
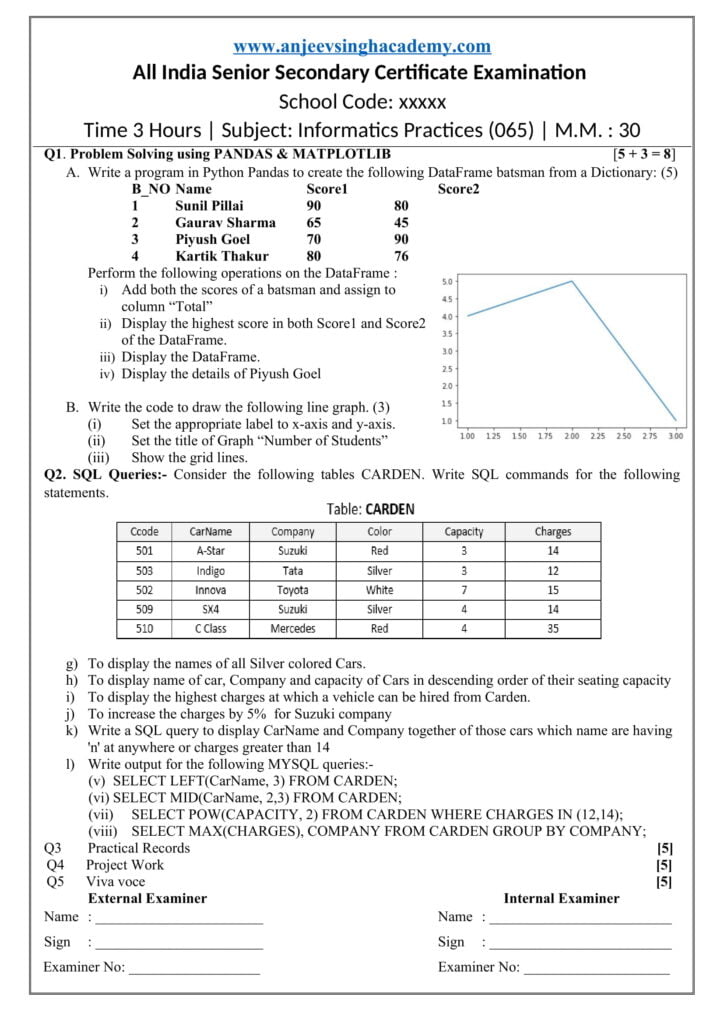
B. Write the code to draw the following line graph. (3)
(i) Set the appropriate label to x-axis and y-axis.
(ii) Set the title of Graph “Number of Students”.
(iii) Show the grid lines.
Answer:
#Que No: 1 (b)
import matplotlib.pyplot as plt
Group = [1, 2, 3]
No_Students = [40, 50, 10]
plt.plot(Group, No_Students)
plt.grid(True)
plt.xlabel(“Class”)
plt.ylabel(“Students”)
plt.title(“Numbers of Students in Class”)
plt.show()
Output:

Q2. SQL Queries: – Consider the following tables CARDEN. Write SQL commands for the following statements.
- To display the names of all Silver colored Cars.
Answer: SELECT CarName FROM CARDEN WHERE Color = ‘Silver’ ;
- To display name of car, Company and capacity of Cars in descending order of their seating capacity
Answer: SELECT CarName, Company, Capacity FROM CARDEN
ORDER BY Capacity DESC;
- To display the highest charges at which a vehicle can be hired from Carden.
Answer: SELECT MAX(Charges) FROM CARDEN;
- To increase the charges by 5% for Suzuki company
Answer: UPDATE CARDEN SET Charges = Charges * 1.05
WHERE Company = ‘Suzuki’;
- Write a SQL query to display CarName and Company together of those cars which name are having ‘n’ at anywhere or charges greater than 14.
Answer: SELECT CarName , Company FROM CARDEN
WHERE CarName LIKE ‘%n%’ OR Charges > 14;
Write output for the following MYSQL queries: –
- SELECT LEFT(CarName, 3) FROM CARDEN;
Answer:
| LEFT(CarName) |
| A-S |
| Ind |
| Inn |
| SX4 |
| C C |
- SELECT MID(CarName, 2,3) FROM CARDEN;
Answer:
| MID( CarName, 2, 3) |
| -St |
| ndi |
| nno |
| X4 |
| CL |
- SELECT POW(CAPACITY, 2) FROM CARDEN WHERE CHARGES IN (12,14);
Answer:
| POW( CAPACTIY, 2) |
| 9 |
| 9 |
| 16 |
- SELECT MAX(CHARGES), COMPANY FROM CARDEN GROUP BY COMPANY;
Answer:
| MAX(CHARGES) | COMPANY |
| 14 | Suzuki |
| 12 | Tata |
| 15 | Toyota |
| 35 | Mercedes |


