
AISSCE XII Informatics Practices 065 – Practical Question Paper Set #3 – Download Word File
All India Senior Secondary Certificate Examination
XII Informatics Practices 065- Practical Question Paper Set #3
Answer Key of Set – 3 Practical Examination Question Paper
Answer Key Set -3
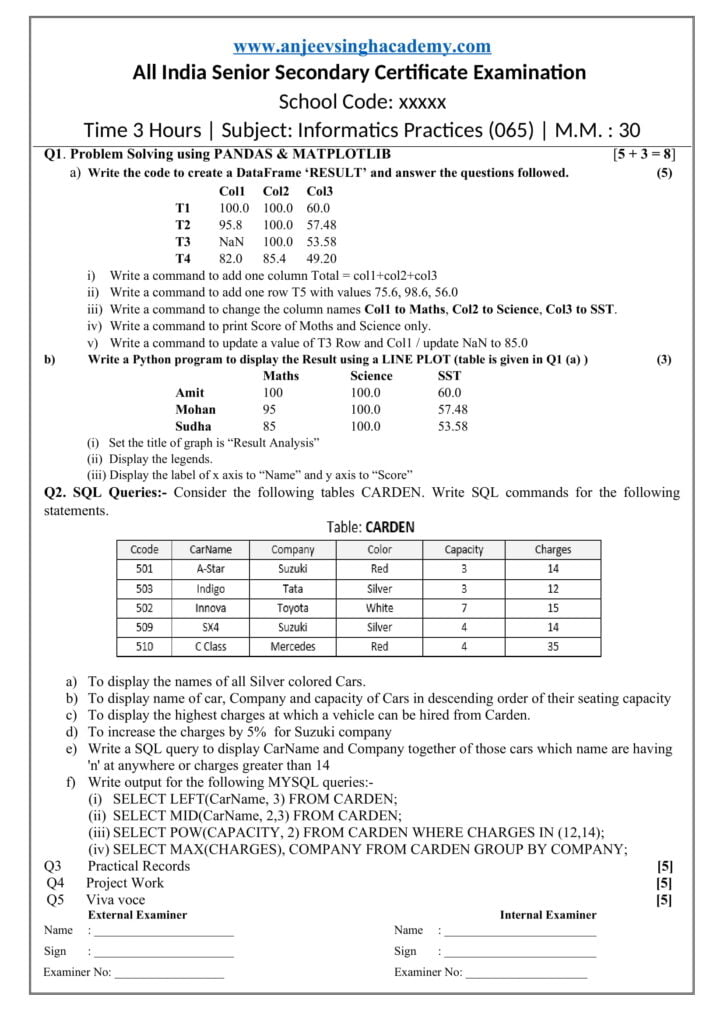
Q1. Problem Solving using PANDAS & MATPLOTLIB [5 + 3 = 8]
A. Write the code to create a DataFrame ‘RESULT’ and answer the questions followed. (5)
Col1 Col2 Col3
T1 50.0 98.0 60.0
T2 95.5 65.0 57.5
T3 NaN 75.0 69.5
T4 82.0 85.4 49.0
(i) Write a command to add one column Total = col1+ col2 + col3
(ii) Write a command to add one row T5 with values 75.5, 98.0, 56.0
(iii) Write a command to change the column names Col1 to Maths, Col2 to Science, Col3 to SST.
(iv) Write a command to print Score of Maths and Science only.
(v) Write a command to update a value of T3 Row and Col1 / update NaN to 85.0
Answer:
import pandas as pd
import numpy as np

data = 	{'Col1':{'T1':50.0, 'T2':95.5, 'T3':np.NaN, 'T4':82.0},
        'Col2':{'T1':98.0, 'T2': 65.0, 'T3':75.0, 'T4':85.4},
        'Col3':{'T1':60.0, 'T2':57.5, 'T3':69.5, 'T4':49.0}
       	}

result = pd.DataFrame(data)

print(result)

print("#i. Add one column Total")
result['Total'] = result['Col1'] + result['Col2'] + result['Col3']
print(result)

print("#ii. Add one row T5 with values 75.6, 98.6, 56.0 ")
result.loc['T5',: ] = [75.5,98.0,56.0,229.5]
print(result)

print("#iii. Change the columns name ")
result.rename(columns = {'Col1':'Maths', 'Col2':'Science', 'Col3':'S.St'}, inplace=True)
print(result)

print("#iv. print Score of Maths and Science only")
print(result[['Maths', 'Science']])

print("#v. Update T3 Row and Col1 / update NaN to 85.0.")
result.at['T3' , 'Maths'] = 85.0
print(result)
Output:
Col1 Col2 Col3
T1 50.0 98.0 60.0
T2 95.5 65.0 57.5
T3 NaN 75.0 69.5
T4 82.0 85.4 49.0
#i. Add one column Total
Col1 Col2 Col3 Total
T1 50.0 98.0 60.0 208.0
T2 95.5 65.0 57.5 218.0
T3 NaN 75.0 69.5 NaN
T4 82.0 85.4 49.0 216.4
#ii. Add one row T5 with values 75.6, 98.6, 56.0
Col1 Col2 Col3 Total
T1 50.0 98.0 60.0 208.0
T2 95.5 65.0 57.5 218.0
T3 NaN 75.0 69.5 NaN
T4 82.0 85.4 49.0 216.4
T5 75.5 98.0 56.0 229.5
#iii. Change the columns Name
Maths Science S.St Total
T1 50.0 98.0 60.0 208.0
T2 95.5 65.0 57.5 218.0
T3 NaN 75.0 69.5 NaN
T4 82.0 85.4 49.0 216.4
T5 75.5 98.0 56.0 229.5
#iv. print Score of Maths and Science only
Maths Science
T1 50.0 98.0
T2 95.5 65.0
T3 NaN 75.0
T4 82.0 85.4
T5 75.5 98.0
#v. Update marks of T4 Ros and Column 1.
Maths Science S.St Total
T1 50.0 98.0 60.0 208.0
T2 95.5 65.0 57.5 218.0
T3 85.0 75.0 69.5 NaN
T4 82.0 85.4 49.0 216.4
T5 75.5 98.0 56.0 229.5
b) Write a Python program to display the Result using a LINE PLOT (table is given in Q1 (a)) (3)
Maths Science SST
Amit 100.0 100.0 60.0
Mohan 95.0 100.0 57.48
Sudha 85.0 100.0 53.58
(i) Set the title of graph is “Result Analysis”
(ii) Display the legends.
(iii) Display the label of x axis to “Subjects Name” and y axis to “Score”
Answer:
import matplotlib.pyplot as plt

Subject = ['Maths','Science', 'S.St']
Amit = [100, 100.0, 60.0]
Mohan = [95, 100.0, 57.48]
Sudha = [85,100.0,53.58]
x_axis = [1,2,3]
plt.plot(x_axis , Amit, label='Amit')
plt.plot(x_axis, Mohan, label='Mohan')
plt.plot(x_axis, Sudha, label='Sudha')
plt.xticks(x_axis, Subject)
plt.legend(loc=1)
plt.xlabel("Subjects Name")
plt.ylabel("Score")
plt.title("Result Analysis")
plt.show()
Output:

Q2. SQL Queries: – Consider the following tables CARDEN. Write SQL commands for the following statements.
- To display the names of all Silver colored Cars.
Answer: SELECT CarName FROM CARDEN WHERE Color = ‘Silver’ ;
- To display name of car, Company and capacity of Cars in descending order of their seating capacity
Answer: SELECT CarName, Company, Capacity FROM CARDEN
ORDER BY Capacity DESC;
- To display the highest charges at which a vehicle can be hired from Carden.
Answer: SELECT MAX(Charges) FROM CARDEN;
- To increase the charges by 5% for Suzuki company
Answer: UPDATE CARDEN SET Charges = Charges * 1.05
WHERE Company = ‘Suzuki’ ;
- Write a SQL query to display CarName and Company together of those cars which name are having ‘n’ at anywhere or charges greater than 14.
Answer: SELECT CarName , Company FROM CARDEN
WHERE CarName LIKE ‘%n%’ OR Charges > 14;
- Write output for the following MYSQL queries:-
- SELECT LEFT(CarName, 3) FROM CARDEN;
Answer:
| LEFT(CarName) |
| A-S |
| Ind |
| Inn |
| SX4 |
| C C |
- SELECT MID(CarName, 2, 3) FROM CARDEN;
Answer:
| MID( CarName, 2, 3) |
| -St |
| ndi |
| nno |
| X4 |
| CL |
- SELECT POW(CAPACITY, 2) FROM CARDEN WHERE CHARGES IN (12,14);
Answer:
| POW( CAPACTIY, 2) |
| 9 |
| 9 |
| 16 |
- SELECT MAX(CHARGES), COMPANY FROM CARDEN GROUP BY COMPANY;
Answer:
| MAX(CHARGES) | COMPANY |
| 14 | Suzuki |
| 12 | Tata |
| 15 | Toyota |
| 35 | Mercedes |


